Nifty 50 on a Slippery Slope:
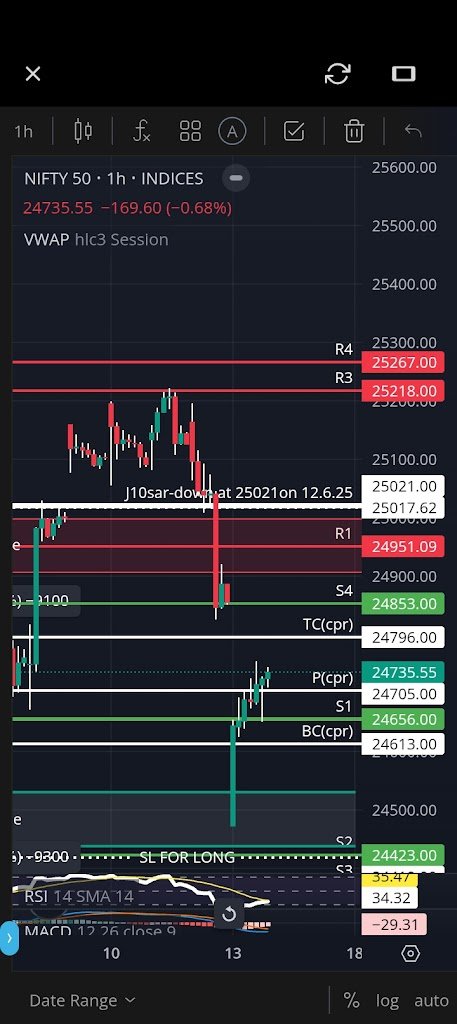
Bearish Signals Amid FII Sell-OffsThe Nifty 50 index, as observed on the 1-hour chart for June 16, 2025, closed at 24,735.55, marking a decline of 169.60 points or 0.68%. This downward movement aligns with a broader bearish sentiment, supported by technical indicators and open interest data. Let’s dive into the market insights, combining the chart analysis with the provided FII/DII activity and open interest changes.
Technical Analysis:
Bearish Momentum Building
The Nifty 50 chart shows a sharp drop, with the index breaking below the key support level of 24,953 (S4) and approaching the next support at 24,656 (S1). The price has also breached the 200-period Exponential Moving Average (EMA) at 25,017.62, a critical long-term support, signaling strong bearish momentum.
The Relative Strength Index (RSI) on the chart is at 29.31, indicating an oversold condition, which could hint at a potential short-term bounce. However, the MACD shows a bearish crossover, with the signal line above the MACD line, reinforcing the downward trend.
A notable signal on the chart is the “J10SAR-down at 25021 on 12.6.25,” suggesting a bearish reversal pattern that has played out as the index fell below this level.
The VWAP (Volume Weighted Average Price) for the session is above the current price in day time frame, indicating that the market is trading at a discount, further pressuring sellers.
Open Interest and FII/DII Activity:
Selling Pressure Intensifies
The open interest data and FII/DII activity from May 2025 provide context for the current market dynamics. On May 12, 2025, the daily index futures variation showed a net decrease of 17,041 contracts, while the daily index options variation dropped significantly by 178,705 contracts. This substantial unwinding of options positions suggests a reduction in speculative activity, often a precursor to a directional move—here, downward.
FIIs have been net sellers consistently. On May 13, 2025, FIIs sold contracts worth ₹45,912 crore in the futures index, with a cumulative selling of ₹76,557 crore over the period.
In contrast, DIIs were net buyers at ₹53,065 crore on the same day, attempting to counterbalance the FII selling.
However, the persistent FII outflows have overwhelmed DII buying, contributing to the bearish pressure on the Nifty 50.
Proprietary traders (PRO) also showed a net selling of ₹25,413 crore on May 13, adding to the downward momentum.
Nifty 50 and Bank Nifty Closing Prices
Nifty 50 Closing Price : 24,735.55 (as per the chart).Bank Nifty Closing Price (May 13, 2025): 55,527 (from the provided data).
Market Insights and Future Movement
Bearish Sentiment Dominates:
The combination of FII selling, declining open interest in options, and the technical breakdown below key support levels indicates a strong bearish outlook for the Nifty 50. The index is likely to test the next support at 24,656 (S1) and could slide further to 24,613 (BC[p]) if selling pressure continues.
Oversold Conditions May Trigger a Bounce: The RSI at 29.31 suggests the market is oversold, which could lead to a short-term pullback towards the 24,953 (S4) level or the 200 EMA at 25,017.62. However, any bounce may be short-lived unless FIIs turn net buyers.
Bank Nifty Correlation: The Bank Nifty index, a significant driver of Nifty 50 movements, also faced selling pressure in May, with FIIs and PROs offloading positions. This sectoral weakness in banking stocks likely contributed to the Nifty 50’s decline.
Cash Market Dynamics:
The cash market data shows FIIs selling ₹1,263 crore on May 13, while DIIs bought ₹3,041 crore. This tug-of-war between FIIs and DIIs in the cash segment highlights the ongoing uncertainty, but FII dominance in derivatives suggests a bearish bias.
Conclusion:
Caution Advised for Bulls
the Nifty 50’s current trajectory points to further downside in the near term, with 24,656 as the immediate support to watch. The persistent FII selling, declining open interest, and technical breakdowns paint a bearish picture.
Traders should remain cautious, as oversold conditions might lead to a temporary bounce, but the broader trend favors the bears. For a reversal, we’d need to see a significant shift in FII activity and a break above the 25,017.62 level.
Anish Jagdish Parashar
Indirect tax india research

Disclaimer: This analysis is for informational purposes only and not financial advice. Market conditions can change rapidly, and investors should conduct their own research before making decisions. Content reflects personal views of the author. For trading and investment purposes consult your financial advisor.
Leave a Reply