Decoding the Market Pulse: Smart Money Moves Behind NIFTY 50 Swings
An Analytical Dive into Institutional Footprints and Price Behavior – Updated as on June 18, 2025
📌 Market Context Overview
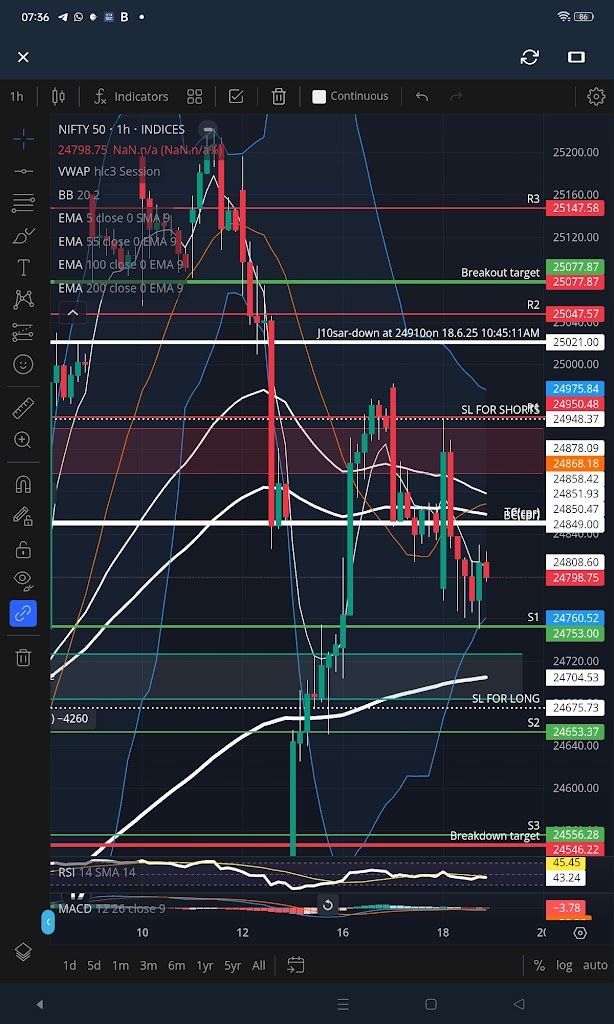
As of June 18, 2025, the NIFTY 50 closed near 24,798.75, holding critical support levels despite volatility driven by institutional repositioning. The price action on the hourly chart indicates a rejection near the 25,200–25,250 zone — a historically significant supply zone, and a pivot point for future direction.
🔍 Key Technical Highlights (1-Hour Chart)
Breakout Resistance: 25,077–25,250
Sell Zone: 24,850–24,980 (Highlighted with rejection wicks)
Buy Zone Support: 24,650–24,700
Breakdown Alert: Sustained move below 24,546 could trigger sharp selling
MACD: Bearish crossover with momentum fading
RSI: Neutral at 45.45, hinting at indecisiveness
🧠 Smart Money Activity Breakdown (FIIs, DIIs, PROs)
Date FII Net (Cash ₹ Cr) DII Net (Cash ₹ Cr) PRO Net (Cash ₹ Cr) Index Futures Index Options
18-Jun 11,028 24,946 55,944 -10,413 -65,529
17-Jun -3,289 13,320 55,527 -25,413 -76,557
14-Jun -11,931 -17,871 -10,117 -17,041 -73,268
🧾 Key Observations:
Despite weak Futures/Options positioning, FIIs turned strong net buyers in cash on 18-June, indicating possible bottom fishing.
DIIs continue aggressive accumulation, absorbing selling pressure from PROs.
A shift in cumulative FII index futures suggests unwinding of shorts, preparing for a possible reversal rally if levels hold.
📊 Strategic Price Zones (As per chart)
Zone Type Price Range Action
Breakout Target 25,077–25,250 Bullish rally potential on close above
SL for Shorts 24,985 Shorts invalidated above this
Buy Zone 24,650–24,700 Ideal accumulation zone
SL for Longs 24,553 Break below invalidates bullish bias
Breakdown Target 24,546–24,520 Severe bearish momentum if breached
🔁 Cumulative Institutional Positioning (Trend Summary)
FII Futures (Net): Sharp reduction in net shorts from -104K to -65K
PRO Index Options: From +320K to +270K suggests hedging or short covering
DII Consistency: Maintaining net positive positions every session – a strong support signal
📈 NIFTY 50 – Outlook Ahead
With a close above 24,750, and supportive DII flows, the short-term bias is neutral-to-positive, but watch for:
Hourly breakout above 25,050 for aggressive longs.
Breakdown below 24,550 invalidates upside setup.
Risk-averse traders may wait for directional clarity around weekly expiry (Thursday), while smart money footprints indicate potential range contraction before a directional expansion.
🧾 Conclusion
Institutional data reveals accumulation beneath resistance. While PROs hedge with options, DIIs are building strong support in the cash market. Keep watch on MACD for bullish crossover confirmation and VWAP reclaim on hourly to align long trades with smart money cues.
Anish Jagdish Parashar
Indirect tax india research

Disclaimer: Content reflects author’s views; For investment decisions and trading proposes consult your financial advisor.
📊 Source: NSE India | Chart Tool: TradingView | Analysis Date: June 18, 2025
Leave a Reply