Market Insights and Probable Movement of NIFTY 50.
Decoding the Market Pulse:
NIFTY 50’s Recent Trends and Institutional Activity
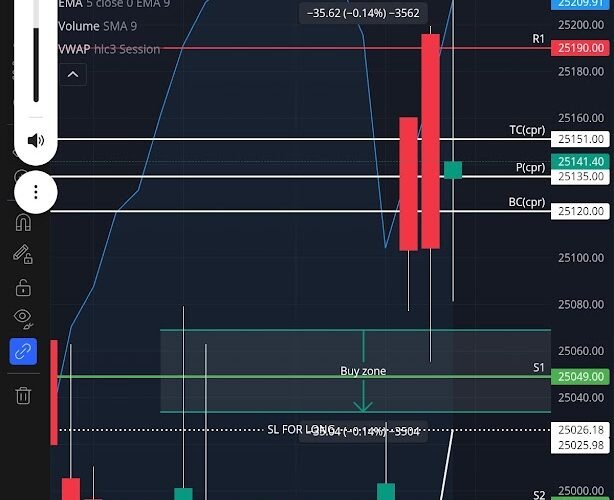
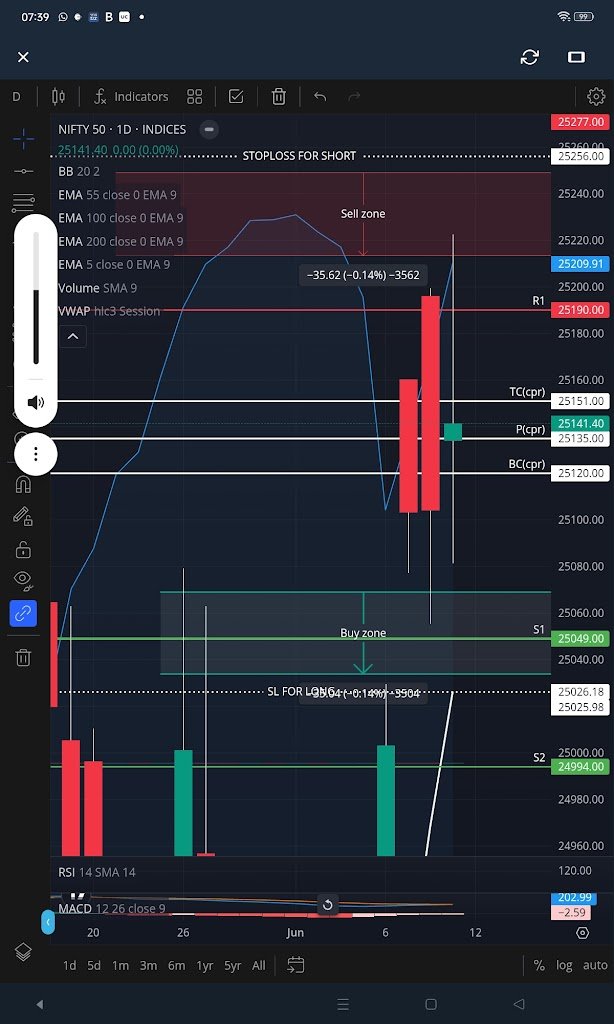
The NIFTY 50 index, closed at 25141.40, reflecting a cautious market sentiment. The chart indicates a recent pullback from a high near 25209.91, approaching the “Buy Zone” between 25049.00 and 25026.18. Technical indicators such as the RSI (14) at 209.20 (oversold territory) and a negative MACD (-5.62) suggest a potential reversal or consolidation. However, institutional activity provides deeper insights into market dynamics. From May 11 to June 12, 2025, Foreign Institutional Investors (FIIs) have consistently sold off in the futures index (net -86549 on May 11), while Domestic Institutional Investors (DIIs) have been net buyers (36082 on May 11). This divergence indicates FIIs are bearish, possibly due to global cues, while DIIs are providing support, stabilizing the index.
2. “FIIs vs. DIIs:
The Tug-of-War Shaping NIFTY 50’s Trajectory
The cumulative net positions in the futures index show a strong bearish stance by FIIs (-72443 on May 28 to -61337 on May 11), contrasted by DII buying (e.g., 45236 on May 3). In the options market, FIIs have also been net sellers (-22802 on May 11), while proprietary traders (Pros) have accumulated long positions (100329 on May 11). This suggests Pros are betting on a potential upside, possibly hedging against FII selling. The daily index futures variation shows volatility, with FIIs swinging from -43907 (May 23) to 14551 (May 29), reflecting uncertainty. The NIFTY 50’s movement near the 200-day EMA (25141.40) and VWAP (25190.00) indicates a critical support zone, with a stop-loss for longs at 25026.18.3.
3.Technical Signals:
Is NIFTY 50 Poised for a Rebound or a Deeper Correction?
The chart highlights a “Sell Zone” between 25209.91 and 25276.00, where the index faced resistance, and a “Buy Zone” near 25026.18 to 25049.00, aligning with the 200-day EMA. The RSI’s oversold reading (209.20) and a bearish MACD (-5.62) indicate short-term weakness, but the proximity to the Buy Zone suggests a potential bounce if support holds. The stop-loss for shorts at 25256.00 and for longs at 25026.18 (with a -0.14% or -35.04-point risk) indicates a tight risk-reward setup for traders. If the index breaks below 25026.18, the next support lies at S1 (25049.00) and S2 (24994.00), potentially signaling a deeper correction towards 24960.00.4.
4.Cash Market Dynamics:
A Glimpse into Retail Sentiment”Cash market data shows fluctuating activity, with cash volumes dropping from 9095 (May 30) to 1584 (May 11). This decline in retail participation aligns with the index’s consolidation phase, as retail investors often reduce activity during uncertainty. Meanwhile, the NIFTY Bank index, closing at 56459 on May 11, has shown relative strength compared to NIFTY 50’s 25141.40, suggesting sector-specific resilience. The interplay between cash market activity and institutional flows will be crucial in determining whether NIFTY 50 holds its support or succumbs to selling pressure.
5. Probable Movement:
Navigating NIFTY 50’s Next Move”Given the technical setup and institutional activity, NIFTY 50 is at a pivotal juncture. If the index holds the Buy Zone (25026.18–25049.00), supported by DII buying and a potential FII reversal (as seen in past swings), it could rally towards the VWAP (25190.00) and R1 (25190.00). However, sustained FII selling and a break below 25026.18 could push the index towards S2 (24994.00) or lower. The RSI’s oversold condition favors a short-term bounce, but broader market cues—such as global economic data or domestic policy announcements—will influence the direction. Traders should watch for volume spikes and FII activity for confirmation of the next move.
Anish Jagdish Parashar
Indirect tax india research

Leave a Reply