Navigating Market Winds: Decoding Nifty 50 Movements and Institutional Flows in May 2025″
The Nifty 50, a benchmark index for the Indian equity market, exhibited notable volatility in May 2025, as reflected in the provided 15-minute chart and institutional activity data. This paper analyzes the index’s price action, futures and options variations, and the roles of Foreign Institutional Investors (FIIs), Domestic Institutional Investors (DIIs), and proprietary traders (PRO) in shaping market dynamics. By integrating technical insights from the chart with institutional flow data sourced from the National Stock Exchange (NSE), we uncover actionable market insights for traders and investor
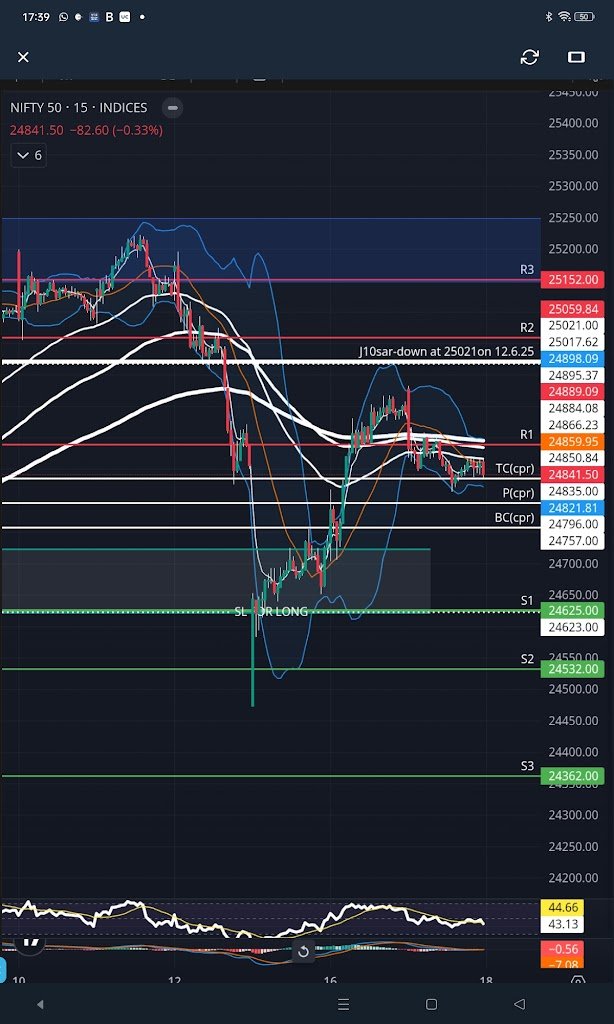
The Indian stock market, represented by the Nifty 50, is a critical barometer of economic sentiment. In May 2025, the index experienced significant fluctuations, driven by institutional activity and derivative market movements. The provided 15-minute chart of the Nifty 50, dated June 17, 2025, shows a closing price of 24,841.50, down 82.60 points (-0.33%). This paper delves into the interplay between index price movements, futures and options data, and institutional buying/selling patterns to provide a comprehensive market outlook.
Technical Analysis of Nifty 50 Movement
The 15-minute chart of the Nifty 50 reveals a consolidation phase within a defined range.
Key observations include:
Price Action:
The index closed at 24,841.50, testing the pivot level (P) of 24,831.80. It remains above the short-term support (S1) at 24,650.00 but below the resistance (R1) at 24,859.95.
Ichimoku Cloud: The price is interacting with the Ichimoku Cloud, suggesting indecision. A break above the cloud could signal bullish momentum, while a drop below may indicate bearish pressure.
Support and Resistance Zones:
The chart marks critical levels—R1 (24,859.95), R2 (25,017.62), and S1 (24,650.00), S2 (24,532.00). The price is in a “SL or Long” zone, indicating a potential setup for a long trade if support holds.
Moving Averages: The price is near the 50-period and 200-period moving averages, reflecting a neutral trend in the short term.
Relative Strength Index (RSI): The RSI at the bottom of the chart reads 44.66, indicating neither overbought nor oversold conditions, aligning with the consolidation phase.
Institutional Activity and Market Sentiment
Institutional flows provide critical insights into market direction. The data from May 2025 highlights the following:
FII and DII Activity:
FIIs were net sellers throughout May, with cumulative net sales of ₹202,916 by May 22, reflecting bearish sentiment. However, by May 16, their net sales reduced to ₹46,369, suggesting a potential slowdown in selling pressure.
DIIs, conversely, were net buyers, with cumulative purchases of ₹235,961 by May 23, providing a counterbalance to FII outflows.
Proprietary traders (PRO) showed mixed activity, with net sales of ₹43,907 on May 23, indicating profit-taking or hedging.
Daily Index Futures and Options Variation:
Futures Index Net: FIIs sold ₹65,811 in futures on May 27, while DIIs sold ₹65,603, reflecting bearish positioning in the derivatives market.Options Index Net: FIIs sold ₹35,159 in options by May 28, while PRO bought ₹14,551 on May 29, indicating divergent strategies among participants.
Index Closing PricesNifty 50 Closing Price: The chart shows the Nifty 50 at 24,841.50 on June 17, 2025.
Cash Market Dynamics
The cash market data shows retail and institutional participation:On May 16, retail cash activity was ₹11,028 (buying), while client activity was ₹238,063 (buying), indicating strong domestic participation.FIIs and DIIs maintained their respective selling and buying trends in the cash market, with FIIs selling ₹65,529 and DIIs buying ₹55,944 by May 16.
Market Insights and Implications institutional Divergence:
The consistent FII selling in May 2025, contrasted with DII buying, suggests a tug-of-war between global and domestic sentiment. FII outflows may be driven by global risk-off sentiment, while DIIs are capitalizing on dips, supporting the market.
Derivatives Positioning:
Heavy selling in futures by both FIIs and DIIs indicates bearish expectations in the short term. However, the options market shows mixed signals, with PRO buying potentially signaling hedging or speculative longs.
Technical Setup:
The Nifty 50’s position near the pivot level and Ichimoku Cloud suggests a breakout is imminent. A move above 24,859.95 (R1) could target 25,017.62 (R2), while a drop below 24,650.00 (S1) may lead to 24,532.00 (S2).
Sectoral Strength: The Nifty Bank Index’s resilience (closing at 55,352 on May 27) highlights the banking sector as a potential safe haven amid broader market uncertainty.
Conclusion
the Nifty 50’s movement in May 2025 reflects a complex interplay of institutional flows, derivatives activity, and technical factors. FII selling pressure, countered by DII buying, has kept the index in a consolidation phase, as seen in the June 17 chart. Traders should monitor the 24,650.00–24,859.95 range for a breakout, while investors may find opportunities in banking stocks given the Nifty Bank Index’s strength. Future market direction will hinge on global cues, FII behavior, and domestic economic indicators.
References
National Stock Exchange (NSE) data on institutional flows and index prices.Technical analysis based on the 15-minute Nifty 50 chart.
Anish Jagdish Parashar
Indirect tax india research

Disclaimer :Content reflects author’s views for investment decisions and trading proposes consult your financial advisor.
Leave a Reply