Unleashing the Power of Nifty 50
Decoding Market Trends and Insights
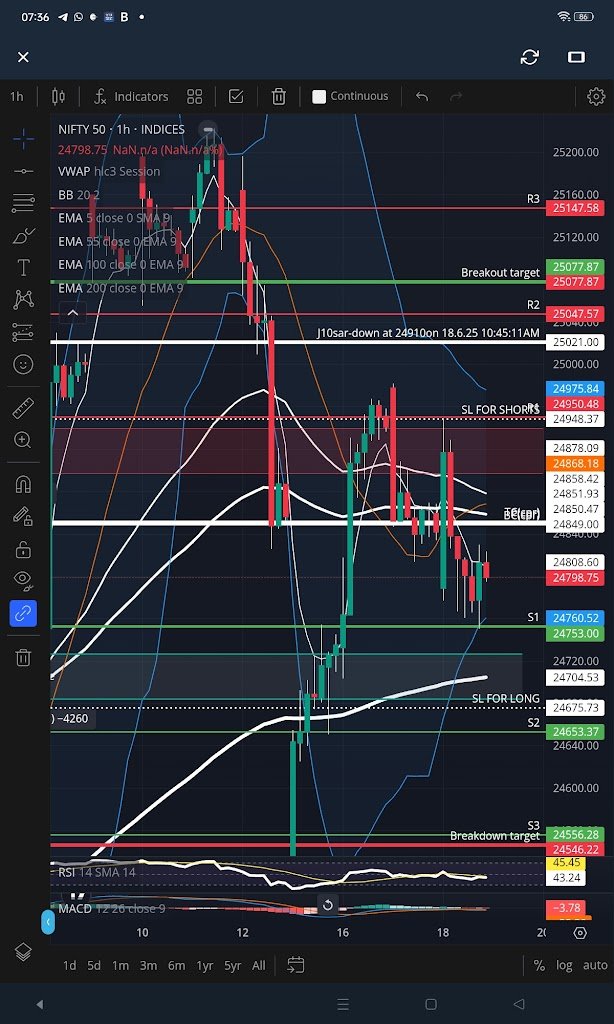
Market Overview
As of June 19, 2025, the Nifty 50 index closed at 24,798.75, reflecting a stable performance with a 0.00% change over the last hour. The chart analysis reveals a critical “Sell Zone” around 24,260 (-0.17% to -0.17%), suggesting potential downward pressure. Conversely, a “Buy Zone” emerges at the same level, indicating a consolidation phase. The breakout target stands at 25,077.87, while the breakdown target is at 24,556.28, providing key levels for traders to watch.
Technical Insights
EMAs and VWAP: The 5-day, 55-day, and 200-day Exponential Moving Averages (EMAs) show a bearish crossover, with the 200-day EMA at 24,260 acting as a significant support/resistance level. The Volume Weighted Average Price (VWAP) at 24,798 aligns with the current price, reinforcing market equilibrium.
MACD and RSI:
The Moving Average Convergence Divergence (MACD) indicates a bearish momentum with a value of -3.78, while the Relative Strength Index (RSI) at 45.45 suggests a neutral stance, nearing oversold territory.
Support and Resistance:
Key support levels (S1-S3) range from 24,760.52 to 24,600.00, while resistance levels (R1-R4) extend from 25,047.57 to 25,320.00.
Futures and Options Analysis
Future Index Net: Recent data shows a mixed trend, with daily index futures variation oscillating between -63,324 (22.5.25) and 156,231 (23.5.25), reflecting short-term volatility.
Option Index Net: Daily index option variation fluctuates significantly, from -202,916 (22.5.25) to 235,961 (23.5.25), indicating active hedging and speculative activity.
Nifty 50 Closing Price: Consistent around 24,700-25,000 range, with NiftyBank closing at 55,572 on 26.5.25, showing resilience in banking stocks.
Institutional Activity
FII and DII Trends: Foreign Institutional Investors (FIIs) have shown net selling, with cumulative figures dropping to -58,317 on 26.5.25 from 270,089 on 16.5.25. Domestic Institutional Investors (DIIs) have countered with net buying, reaching 60,44 on 26.5.25, suggesting a bullish domestic outlook.
Pro and Cumulative Data: Professional activity and cumulative positions indicate a cautious approach, with FIIs reducing exposure (-46,369 on 26.5.25) and DIIs maintaining steady accumulation.
Strategic Outlook
The Nifty 50’s current stability masks underlying volatility, driven by FII selling and DII buying. Traders should monitor the 24,760 level closely— a break below may trigger a decline to 24,556, while a push above 25,077 could signal a bullish rally.
Anish Jagdish Parashar
Indirect tax india research

Disclaimer: Content reflects author’s views; for investment decisions and trading proposes consult your financial advisor .
Leave a Reply